TYMORA: Project Timeline Google Sheets Template
Important: you need to be signed in to a Google account to copy the template to your Drive. Need help opening the template?
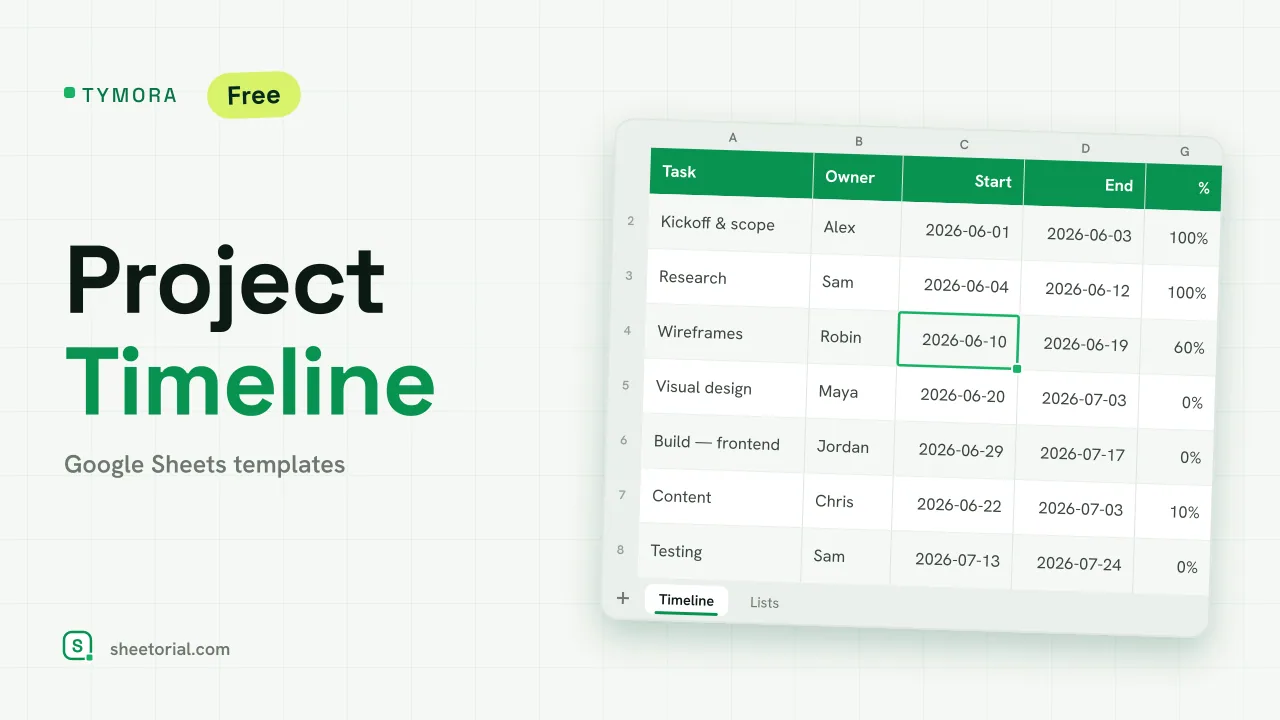
TYMORA lays a project out as a timeline and draws the bars for you. Each task carries an owner and a span; a grid of weeks to the right shades the cells that fall inside that span, so the schedule reads like a light Gantt chart without any chart to maintain. It's a project timeline template for Google Sheets with no account behind it and no trial — the free .xlsx download is the product, and it opens in Google Sheets, Excel or LibreOffice.
What the project timeline template holds
The Timeline tab starts with one editable cell — the project start date — and then a row per task: task name, owner (from a dropdown), start, end, duration in days, status and percent complete. To the right sit ten week columns, Wk 1 through Wk 10, whose header dates chain off the project start. The Lists tab is the editable source of the dropdowns: your team's owners and the task statuses (Not started, In progress, Blocked, Done).
How the Gantt grid and the duration work
Duration is calculated, not typed: the sheet takes end minus start, inclusive of both ends, so a task that runs Monday to Friday reads five days. The week headers are chained — the first reads the project start, each next one adds seven — so moving the start date slides the whole grid. The bar itself is conditional formatting: a week cell turns green when that week falls inside the task's start-to-end span, which is what gives you the Gantt look. Two more rules read the status, shading a Done row green and a Blocked row red. Ten sample tasks arrive across the weeks with varied statuses and progress, so the bars and the status colours are visible before you replace them.
How to plan a project timeline in Google Sheets
- Set the project start date — the week headers recalculate on their own.
- List your owners and statuses on the Lists tab if you want different ones.
- Add each task with its start and end; the duration in days fills itself in.
- Read the grid: the green cells are each task's span — that's your Gantt bar.
- Mark status and percent as you go; Done turns green and Blocked turns red.
A project timeline in eleven languages
Project teams don't all work in English, so TYMORA ships in eleven language editions — each a separate .xlsx with tab names, column labels, owner samples, statuses and date formats translated, formulas left intact. Download the one that matches your page language, and use the opening guide if the .xlsx import step is unfamiliar.
A timeline sets the dates; the day-to-day execution lives elsewhere. The day schedule template blocks out a single working day and the to-do list template carries the loose tasks, while the rest of the set sits under project management templates for Google Sheets.
More templates
-
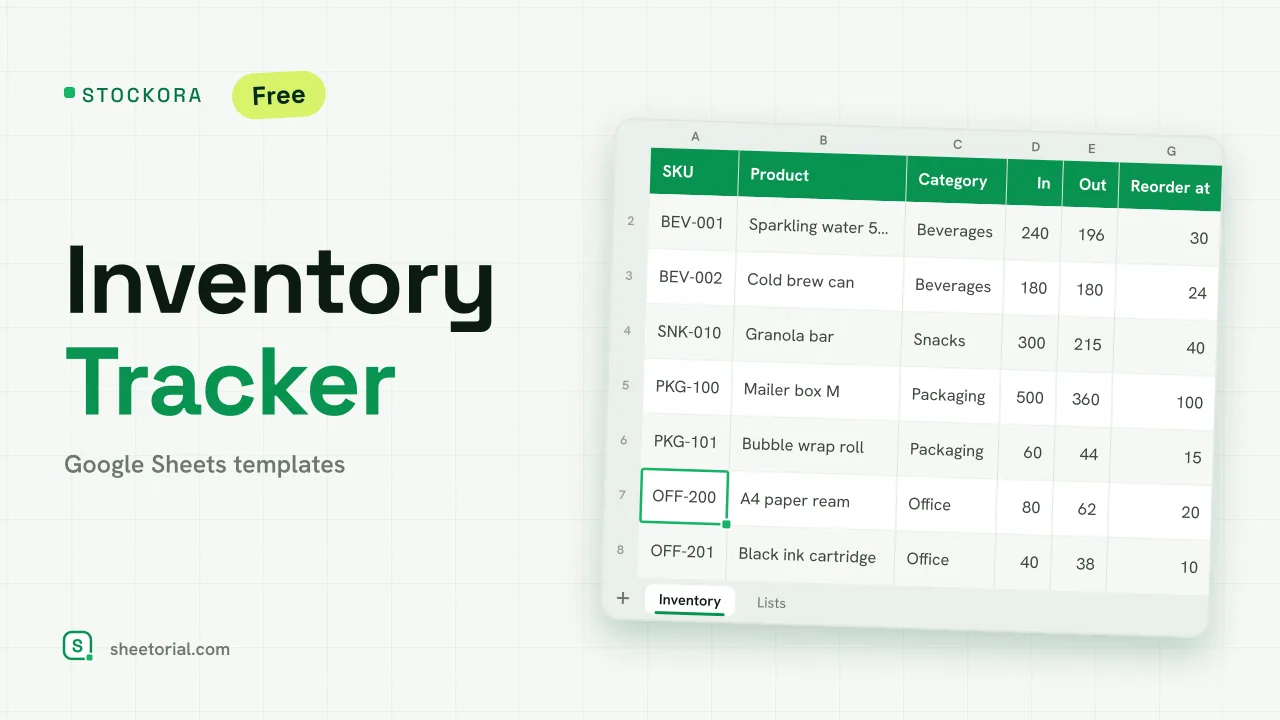 Inventory Spreadsheet STOCKORA: Small Business Inventory Template for Google Sheets Small business inventory template for Google Sheets: stock in/out, current stock and value, reorder alerts and totals. Free XLSX, no account, no trial. View template →
 -
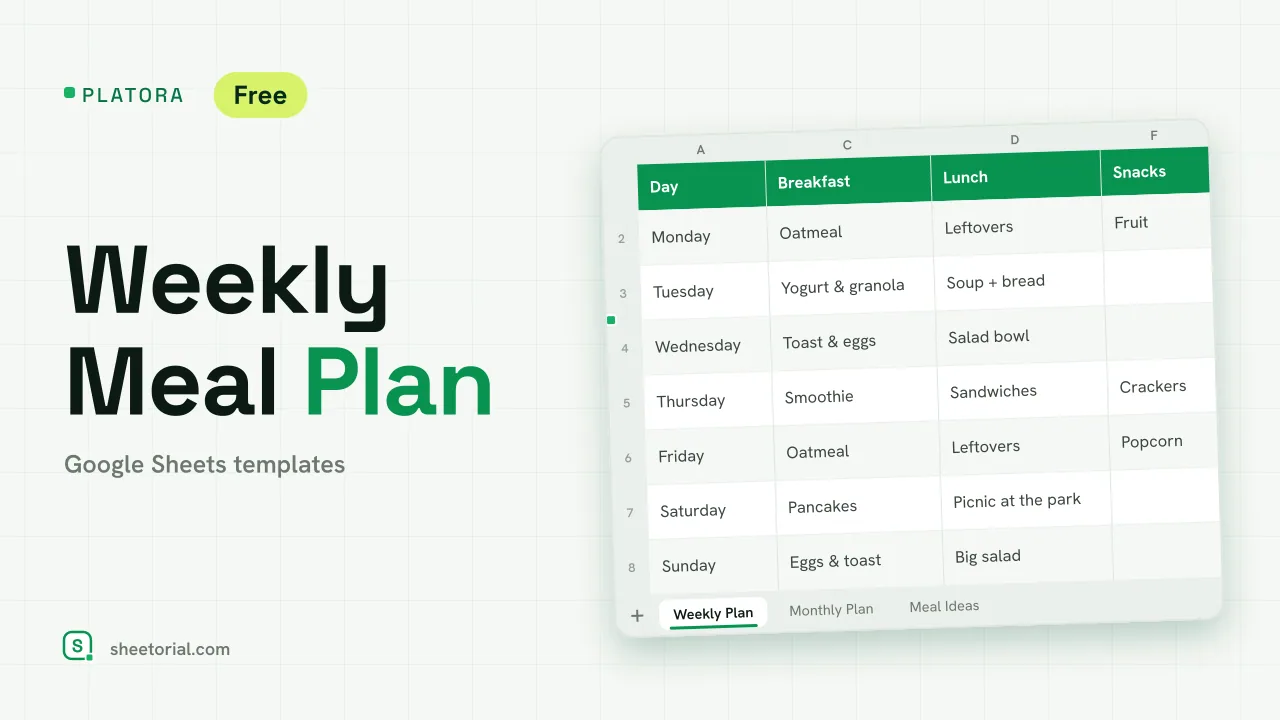 Meal Planning PLATORA: Free Weekly Meal Plan Template for Google Sheets Free weekly meal plan template for Google Sheets with breakfast, lunch, dinner and snacks per day, a dinner ideas dropdown and a monthly view on its own tab. View template →
 -
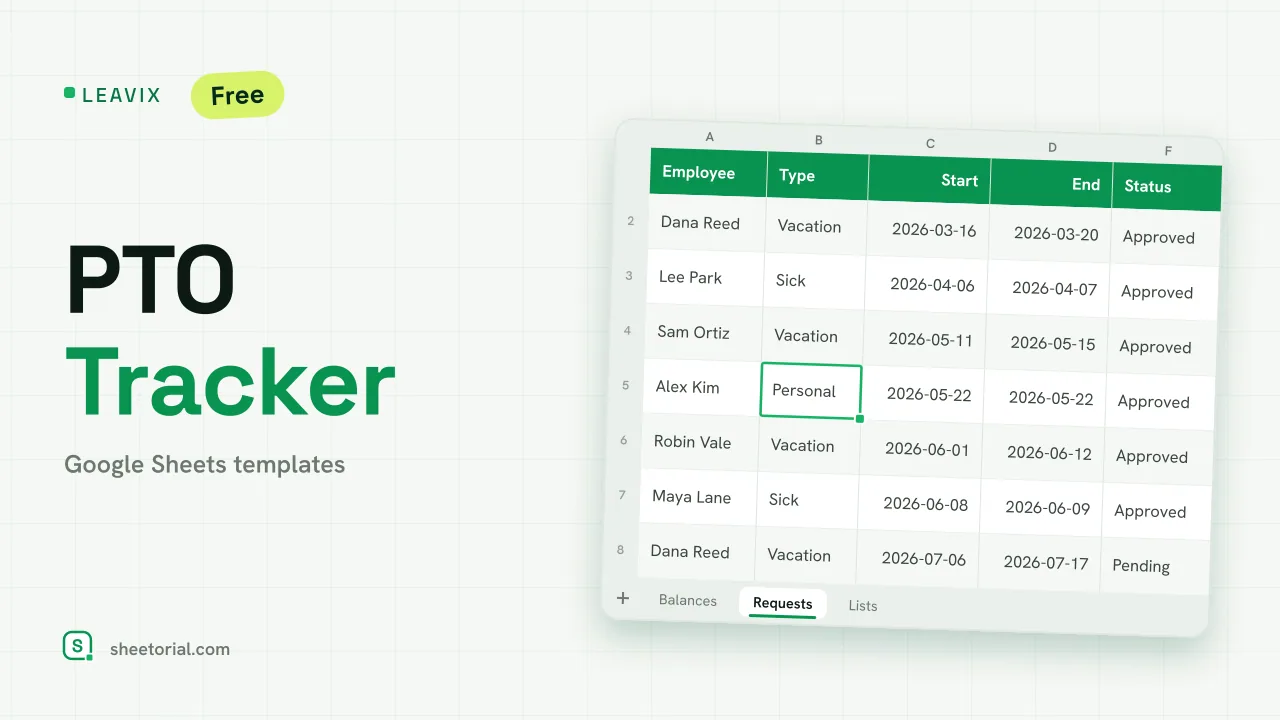 HR & Time Tracking LEAVIX: PTO Tracker for Google Sheets PTO tracker for Google Sheets: allowance, taken and remaining days per employee, plus a leave request log where only approved days are deducted. Free. View template →
 -
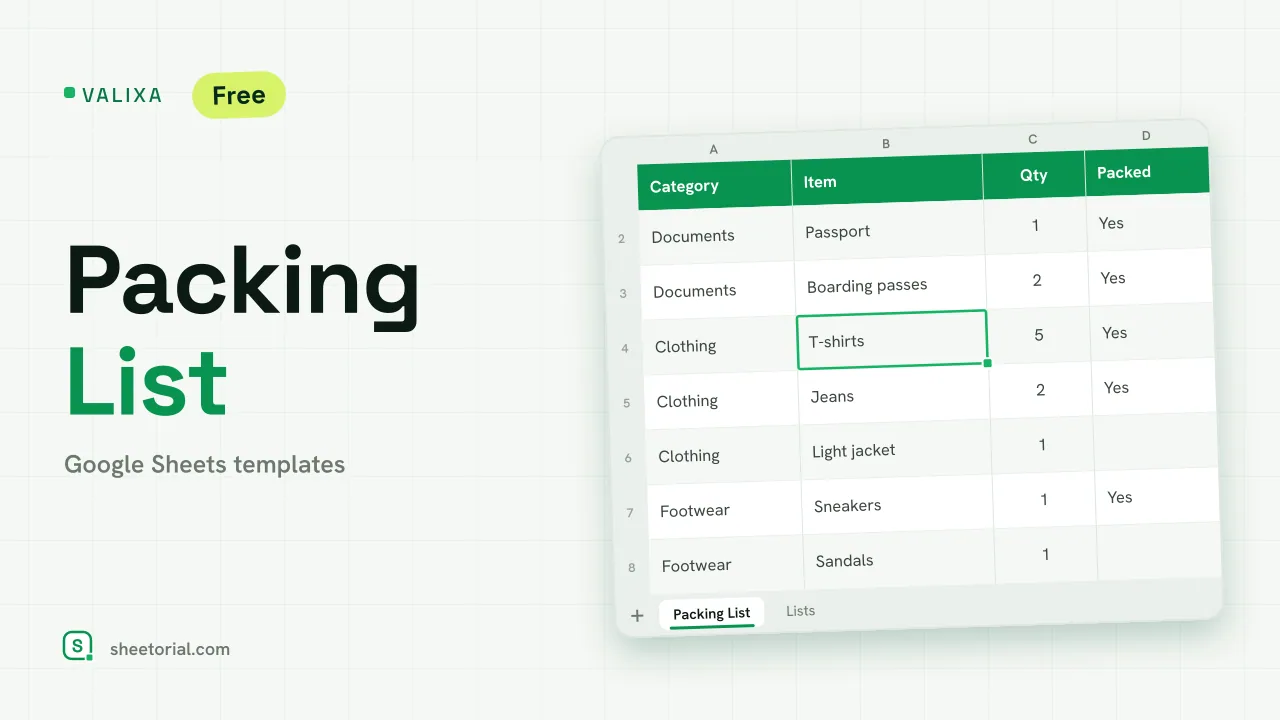 Travel & Itinerary VALIXA: Packing List Template for Google Sheets Free packing list template for Google Sheets: items by category, quantities, a Packed dropdown and a progress counter that says what's left to pack. View template →